As a seasoned Excel user, I can’t stress enough how integral spreadsheet mastery is across various job profiles. From the meticulous world of accounting to the dynamic realm of data analysis, and even in the broad spheres of marketing and project management, being fluent in Excel is more than just a skill—it’s a professional game-changer. It’s fascinating to see how Excel’s versatility extends to nearly every aspect of business operations in today’s workforce. I’m excited to dive into the nitty-gritty of Excel, unpacking the essential abilities at basic, intermediate, and advanced levels. Whether you’re just starting out or looking to polish up your data wizardry, mastering these top-tier Excel capabilities is an absolute must for anyone looking to up their game in the office suite battleground.
The beauty of Excel is that there’s always something new to learn, a clever function to discover, or a faster way to accomplish tasks. As we embark on this learning journey together, I’ll be tucking into the top 10 Excel skills that stand out from the rest. These aren’t just any skills; they’re the cream of the crop—the ones that will make you stand out in a crowded job market and increase your efficiency and effectiveness. Whether you’re a data analyst seeking to interpret complex data sets, an accountant sifting through figures, or in any role that benefits from data entry and analysis, these skills are your ladder to career growth and proficiency in the digital workspace. Let’s roll up our sleeves and get to work!
Basic Excel Skills
1. Saving and Opening a Workbook
I often start by ensuring I know how to save and open my Excel workbooks. Clicking on the File tab, I see options to save or open documents. For first-time saves, I choose the “Save As” dialogue box, select my desired location and file format, and for subsequent saves, I’ll just hit Control + S. Opening a file involves clicking “Open” from the File tab and selecting the appropriate file.
2. Managing Worksheets
Worksheets are the heart of my data organization in Excel. At the bottom, tabs let me navigate through them. Adding a new worksheet is as simple as clicking the plus button or using Shift + F11. Right-clicking a tab allows for deleting a worksheet, but I remember this is permanent.
3. Formatting Cells
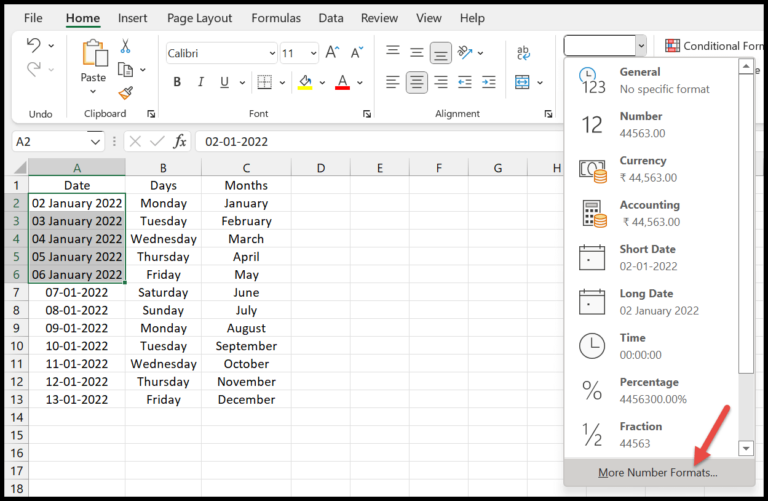
Cell formatting is versatile, right from the Home tab. I use the font group to embolden or italicize text, adjust size, and color. Text alignment and wrapping text are also handy tools in the alignment group, and when dealing with numbers, the number group lets me choose formats like accounting or percentage.
4. Printing
To print, I click on the print button under the File tab or use Control + P for the print preview. Fine-tuning printouts is possible with options like print area, page range, orientation, page type, margins, and scaling to ensure my printouts look just right.
5. Excel Functions (Basic)
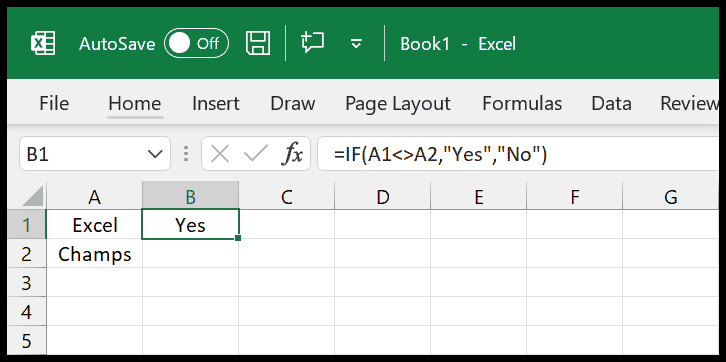
My toolbox of basic Excel functions includes essentials like SUM to tally values, COUNT for counting numbers, and AVERAGE for finding means. DATE and TIME are imperative for handling chronological data, while LEFT and RIGHT help snip text strings. VLOOKUP aids in cross-referencing data, IF tests conditions, and NOW keeps me updated with the current date and time.
6. Charts
I love to visualize data with charts, creating vivid pie, line, or bar graphs right from the Insert tab. It’s an approachable way for me to spot trends and make data-driven decisions.
7. Sorting Data
Efficient data analysis often requires me to organize information, so I rely on sorting features. Whether it’s ascending, descending, or custom sorts, it’s a breeze to reorganize my data.
8. Find and Replace Option
Just like editing a document, I use Find and Replace to quickly update large datasets, change formulas, or correct data entries—all with a few clicks or a handy shortcut, usually found in the Home tab.
9. Paste Special Option
Paste Special is a real game-changer. Copying and pasting not only the content but also the formats, or even formula calculations, without altering the existing values, makes my work seamless and efficient.
10. Keyboard Shortcuts
Keyboard shortcuts are a huge time-saver for me. They allow quick actions like copy, paste, save, or format without even touching the mouse—Control + C and Control + V are practically second nature.
11. Go To Special
The Go To Special function is my go-to when I need to quickly navigate to specific cells with comments, formulas, constants, or even blanks, which is especially useful in large datasets.
12. Pivot Table
When it’s time for some serious data analysis, I turn to Pivot Tables. It’s a straightforward way for me to summarize, analyze, explore, and present my dataset.
13. Named Range
Named Ranges simplify my formulas and navigation through the workbook. By assigning names to cells or ranges, I make my formulas easier to read and manage.
14. Drop Down Lists
Drop Down Lists are my solution for data validation. It restricts data entry to specific choices, ensuring consistency and accuracy across my data.
15. Conditional Formatting
Conditional Formatting lets me highlight critical entries, identify trends, and make my spreadsheets visually appealing. I set rules, and Excel does the rest, coloring cells based on my conditions.
16. Excel Table
Excel Tables offer a structured way to manage my data. With sortable columns, filterable headers, and a sleek design, it’s a neat way to organize information.
17. Idea Button
When I’m looking for insights and trends without diving deep into data crunching, the Ideas button is my ally. It suggests patterns and generates pivot tables to better understand my data.
18. Using Sparklines
Sparklines give me the ability to insert small charts into individual cells, providing a quick visual representation of a data trend over a period directly adjacent to the data itself.
19. Text to Column
With the Text to Column feature, I easily split text from one cell into multiple cells, which is fantastic for cleaning up and organizing data imported from other sources.
20. Quick Analysis Tool
When I select a range, the Quick Analysis tool pops up offering formatting, charts, totals, and more. It’s like having an assistant suggest the best way to analyze my selected data.
Advanced Excel Skills
21. Advanced Excel Formulas
I often use powerful combinations of Excel functions to perform complex calculations. Here’s a sneak peek at some formulas I can’t live without:
- SUMIFS for conditional sums
- INDEX MATCH for advanced lookups
- XLOOKUP as a versatile lookup tool
- COUNTIFS to count with multiple criteria
- The ever-powerful ARRAY FORMULAS
- IFERROR to keep spreadsheets error-free
Remember, mastering these requires practice, so don’t shy away from experimenting with them.
22. Advanced Excel Charts
To make my data pop, I dive into advanced Excel charts. These aren’t your average bar and pie charts; these are dynamic tools like:
- Waterfall charts for financial analysis
- Gantt charts for project management timelines
- Heat maps for spotting trends and variations
- Sunburst charts for hierarchical data visualization
You can find easy tutorials that’ll guide you through creating such informative and visually appealing charts.
23. Visual Basic for Applications
Whenever I need to automate repetitive tasks, I turn to VBA. Knowing VBA allows me to:
- Create powerful macros to save time
- Build user forms for easy data entry
- Automate report generation and data analysis
- Control Excel’s environment programmatically
It may look intimidating at first, but with some patience, you can automate practically anything in Excel.
24. Power Query
Power Query is my go-to for ETL tasks—extracting, transforming, and loading data. This robust tool lets me:
- Clean up messy data sets with ease
- Merge data from various sources
- Transform data formats with simple steps
- Automate data refreshing to keep my reports up to date
Learning to navigate Power Query is a game-changer for handling large datasets efficiently.
25. Power Pivot
When working with massive data sets, Power Pivot is my secret weapon. With it, I can:
- Import and analyze millions of rows of data
- Create complex models to understand my data better
- Use DAX formulas for specialized calculations
- Build interactive dashboards with slicers for easy data exploration
Getting familiar with Power Pivot takes my data analysis to a whole new level of proficiency.


