When I first got my hands on Excel 2010, Power Pivot was all the buzz for crunching large datasets and performing advanced data analysis. Unlike the add-ins that came pre-activated in previous Excel versions, Power Pivot was something you had to set up manually. That was a bit of a snag if you weren’t in the know. It didn’t just add a new dimension to my spreadsheets; it practically turned them into a powerhouse, threading through massive amounts of data like it was nothing.
Now, I’m no stranger to the rest of the suite: Power Query for grabbing and transforming data, and of course, the rest of the powerful business intelligence tools. Linking Excel with Power BI, another Microsoft gem, just took things to a whole new level. With all these subscription benefits, I could create some seriously slick data visualizations. And even though there are loads of advanced features, you don’t need to be an expert from the get-go. There’s a ton of training courses and communities out there, helping anyone eager to learn.
System Requirement to Enable Power Pivot in Excel
- OS: Windows Excel (32 or 64-bit)
- Memory: At least 1 GB RAM; 2 GB is better
- Disk Space: Ensure 3.5 GB free space
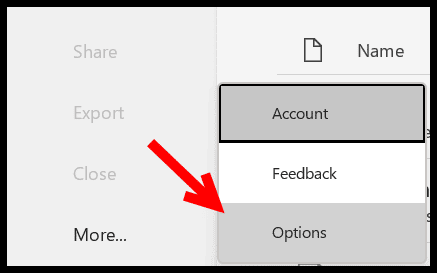
To activate Power Pivot, go to Excel Options via the File tab. Find COM Add-ins in the Excel Options, and select the Microsoft Office Power Pivot to enable. Check for any disabled items related to Power Pivot that may require a reactivation through the Excel ribbon or possibly deeper troubleshooting, like accessing the registry editor or the developer tab.
Steps to Enable Power Pivot in Excel 2010-2013
First, I make sure to download Power Pivot from the Microsoft’s Download Center. Here’s the link: download Power Pivot. Installation is straightforward and takes just a few minutes.
After installing, I open Excel and there’s a new PowerPivot tab waiting in the ribbon. It’s that simple! Now I’m ready to use features like:
- Importing large volumes of data from various sources
- Creating advanced relationships and calculations
- Crafting complex DAX formulas
- Developing PivotTables and PivotCharts with enhanced analytics
With this new tool, I can analyze data more profoundly and leverage advanced analytics right in Excel.


